[Virtual Event] Agentic AI Streamposium: Learn to Build Real-Time AI Agents & Apps | Register
Stream Processing with IoT Data: Challenges, Best Practices, and Techniques
The rise of IoT devices means that we have to collect, process, and analyze orders of magnitude more data than ever before. As sensors and devices become ever more ubiquitous, this trend in data is only going to increase. And that is a really good thing! It’s transforming myriad industries: healthcare can now track patient health in real time and even provide on-demand care; manufacturing is able to understand the details of production lines and predict issues before they happen; the automotive industry is leveraging sensors not only for self-driving but also to provide deeper, real-time insights, allowing engineering to preemptively fix issues before drivers ever notice them. And this is just a taste of the potential power of IoT devices.
In my day job, I lead stream processing for the Data Platforms Team at Tesla. At Tesla, we unlock insights into our fleet by processing trillions of events per day from every part of the business, with just a handful of people. This has helped Tesla become an industry leader by opening up new abilities, like being able to run complex predictions against our entire fleet to optimize efficiency or inform the next generation of manufacturing. All of this, and more, is enabled by a system capable of ingesting, processing, storing, and serving these trillions of data points.
At first blush, IoT data streams look a lot like common web server log events. You have events being generated, sometimes at high volumes, and they need to be processed and either made available to downstream consumers or stored in databases. IoT just means more events, right?
Once you dig in, it turns out you have all of the usual “server log” challenges and then a slew of new ones to contend with as well. Instead of web servers that are probably within your network and under your control, you now have a large number of devices with variable connectivity, leading to bursty data and a long tail of firmware versions (you can’t just stop supporting some versions) with old data formats. At the same time, some of these devices can go “insane” and start dumping piles of data on your infrastructure, which can feel like a Denial-of-Service (DoS) attack. With that long tail of devices, DoS-like events can become part of the business process and need to be designed for upfront.
Unfortunately, it gets even worse. Some of your data streams—especially if you have devices that are at all related to medical or health & safety—could be high priority and require very low latency. These data streams can be mixed in with streams that are just high-volume “normal operations” streams used by analysts for evaluating and understanding the health of your device fleet. Now you have mixed service levels in a shared environment that you need to worry about.
To compound the challenges further, many times these data streams can have widely varying data formats, which independently evolve on their own. As a team focused on stream processing, you probably also don’t have control over where or when those changes happen. And the data formats on devices are not likely to be nice formats like Apache Avro™ or Protobuf, because of CPU requirements and/or the desire to have more dense storage and transmission of data. (Hopefully they do continue to support at least versioning, if not compatibility guarantees, to help make processing tractable.)
Beyond that, you will also need to add some basic fleet management and overview functionality. You will need to understand if devices are healthy, sending good data, generating weird skew, etc. Given that you are dealing with hardware, there are inevitably going to be weird bugs that only trigger one in a million times; at scale, these kinds of corner cases are daily occurrences that you need to not only guard against but actively monitor.
Taken all together, this can feel nearly insurmountable. Fortunately, if you are facing some or all of these kinds of problems, there are approaches to point you in the right direction.
Designing from first principles
A common organizational split is to have a firmware team that deals with making the device actually work and a server-side data team that handles the rest of the data pipeline, from collecting the events to processing, storing, and serving that data to the rest of the organization. We’re going to look in detail at the latter: how does one go about building the infrastructure necessary to support millions of devices and trillions of data points per day, without burning piles of money and going crazy trying to operate these systems?
Before even deciding on technologies, the first question we should ask is: What kind of capabilities do I need from my system? There are a number of things you might want to include, but for IoT, here is a nice set of core requirements:
- Durable storage
- Easy horizontal scalability
- High throughput
- Low latency
Remember, our big problem here is not how to get the data from the devices. Instead, our challenge is to receive that data and quickly process it, making it available to downstream users so that they can produce the insights and improvements that really move a company forward.
The core piece of technology that enables us to meet all of these goals is Apache Kafka®. It provides resilient storage that we can trust to not lose our important messages. It can scale horizontally beyond the next or even next-next order of magnitude, without becoming harder to run or adding significant operational overhead. Kafka also provides native stream processing capabilities, and whether you use these or just use the producer and consumer APIs, Kafka can be blazingly fast (low latency) while maintaining incredibly high throughput.
On top of fulfilling all of our requirements, Kafka is also very stable, well supported, and has a robust community. As long as we are careful in designing the system around Kafka, there should be no problem scaling up to tens of trillions of events per day, while keeping the operational burden of scaling our systems growing sub-linearly with the volume of data. Most importantly, we need to build a system that can be successfully operated at a continuously growing scale.
Having settled on Kafka as the core of our infrastructure, we can start to sketch out some of the rest of the pieces of our processing system.

Let’s look at what we need to build around this core. We need to land the data from the devices into Apache Kafka, implement stream processing to make that raw data usable, and make the data accessible to others. As always, the devil is in the details of how to structure this processing so that it is flexible, scalable, and maintainable. Remember, these data processing steps will be used by many different data streams in various formats, all while still being able to handle trillions of events every single day. Our task is then to define primitives that are flexible enough to be reused for all of the different use cases while still scaling.
We need a set of repeatable patterns, ones that we know can scale to any volume. Those patterns can be readily applied to new data streams and devices, so we are ready to scale not only up by volume but also out by data type and stream—while limiting the operational load on our teams.
This is not a simple matter, but it is a worthwhile investment given the benefits that it provides. We’ll look at how to build a rock-solid system—from ingestion, to processing, to understanding the state of our device fleet—that seamlessly scales up with your organization.
Raw data ingest
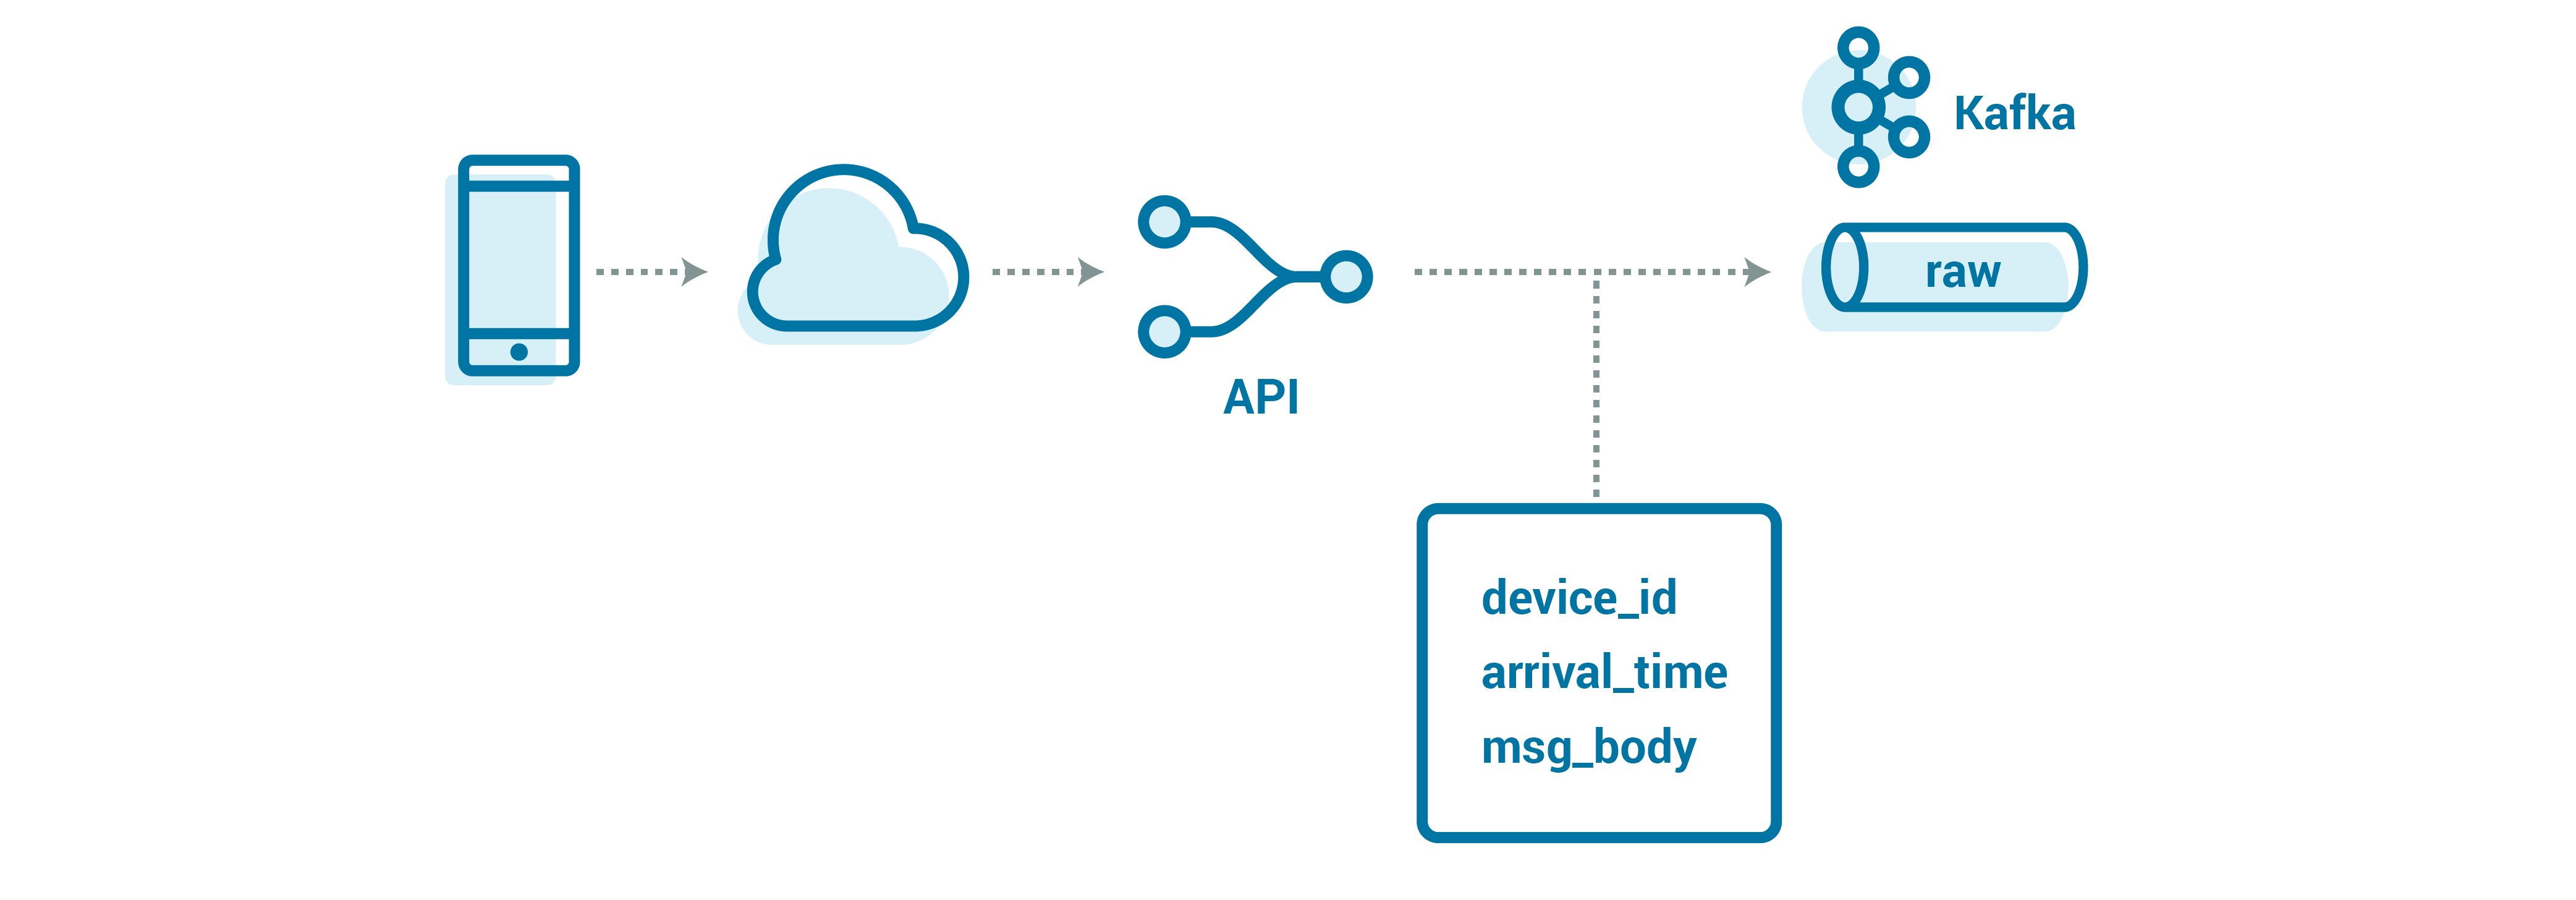
Let’s start with how we expose the system to devices. We need a small intermediary to abstract the Kafka client complexities from our devices, which often have computational and bandwidth constraints. This also provides a place to make quick changes to activities like data routing (i.e., the topic to which the device data should be directed); we can roll these changes out server side without having to make and push firmware changes.
This intermediary could be a web server speaking REST or an MQTT endpoint—the protocol really depends on what your devices and firmware engineers can support. The web server can also allow devices to use a much slimmer runtime environment, rather than a bulky Kafka client library.

Great! Now that we have an API in place, we can do some simple routing and management of events.
There are a couple of competing needs here. Some payloads are likely to be large (where devices that have been offline have lots of history to catch up on), while others need to be durable (not lost), available (for consumption), and rapidly processed (converted to a usable form and possibly stored externally). Many messages are just business-as-usual events and can arrive late, but they should never be lost. Others are more ephemeral—data that would be “nice” to have but could be dropped if necessary—either to manage load or to reduce the cost of replication.
So, naturally, we need to have different mechanisms for storing and processing each of these kinds of messages.
One of our hardest problems is making sure that the data is truly durable. Conveniently, this is also the precursor to doing any data processing. The API server also has one more job beyond routing: making sure that the data is durable before it confirms success to the client, so that the client knows if it should resend the data. However, for devices that have short-lived, on-device storage, or that are sending their “last gasp” data before they die, we might only have one chance to catch that data, so it is often vitally important that the data lands the first time, whenever possible.
A key part of ensuring that the first message attempt is the only necessary attempt is ensuring that there is no “congestion” when writing to Kafka. That means that sufficient capacity is allocated and that load is distributed evenly across servers, such that any given message can be durably stored.
Partitions are the unit of scale in Kafka, meaning that we can easily scale horizontally by just adding partitions. However, just as important is the mechanism by which messages are assigned to partitions—the partitioning strategy. Our partitioning strategy uses the epoch millisecond in which the message was received, giving a reasonably uniform distribution of data over even a few seconds of events. This enables us to land data as quickly as possible while helping to ease operational burden and growth, since we can just add more partitions and continue to scale horizontally without touching anything else in the system.
Handling large messages
One of the unique challenges with device data streams, as opposed to web server log data streams, is that it is normal for devices to become disconnected for a long while—easily months—and to then send a huge amount of data as they come back online. Depending on how your device firmware is written, this could mean many, many small messages (which can be wasteful for storage and bandwidth considerations), or, more likely, the backlog of small messages batched together as a couple of large messages. If we were to just blindly write these into the same Kafka topics that we were planning to use for regular ingest, it could easily overwhelm our cluster.
I’ve seen Kafka happy with messages up to 1 MB, with very little tuning of configuration parameters needed. At the same time, I have heard of people regularly handling messages of 20 MB (e.g., Vorstella) and upwards, but that requires significant tuning. However, this can start to become a very tricky game of trying to balance managing large messages while also supporting latency and performance for smaller messages, all in the same cluster.
One approach is to split Kafka clusters by workload type: one for small messages, one for larger ones. The disadvantage is that you can quickly get in over your head operationally. Once you make the choice, it is a slippery slope that can lead to you having to manage many Kafka clusters and use cases. Just operating a few clusters can hamstring a small team, so the decision to split data by cluster should not be made lightly.
Here are two common, alternative approaches that we can take to handle these large messages within a single cluster:
- Chunking up the message into pieces
- Storing a message reference in Kafka to an external store
To learn more, you can check out these resources for a start:
- Large Message Handling with Kafka: Chunking vs. External Store
- Handle Large Messages in Apache Kafka
- li-apache-kafka-clients for handling large messages natively
Now, let’s examine how useful these two approaches could be in our situation.
Considering that many of the custom formats we will be using from the device are not easily splittable (for example, if they’re a custom binary format handcrafted for our devices), a chunking approach starts to become more complicated. Within each processing step, we have to maintain state that persists between chunks so that we can understand data from later chunks.
On top of that, we also need to add logic to understand the start and end of a message, as well as handle cases where one of those chunks is missing or out of order. The API side also gets more complex, as we also need to ensure that chunks end up in the same partition. That in turn can easily ruin the nice uniform distribution that we discussed above, in which message partitions are assigned based on the current timestamp. The net impact: it will dramatically affect the time between when data arrives and when it is processed. It also increases the risks of not landing the data and of not making it durable.
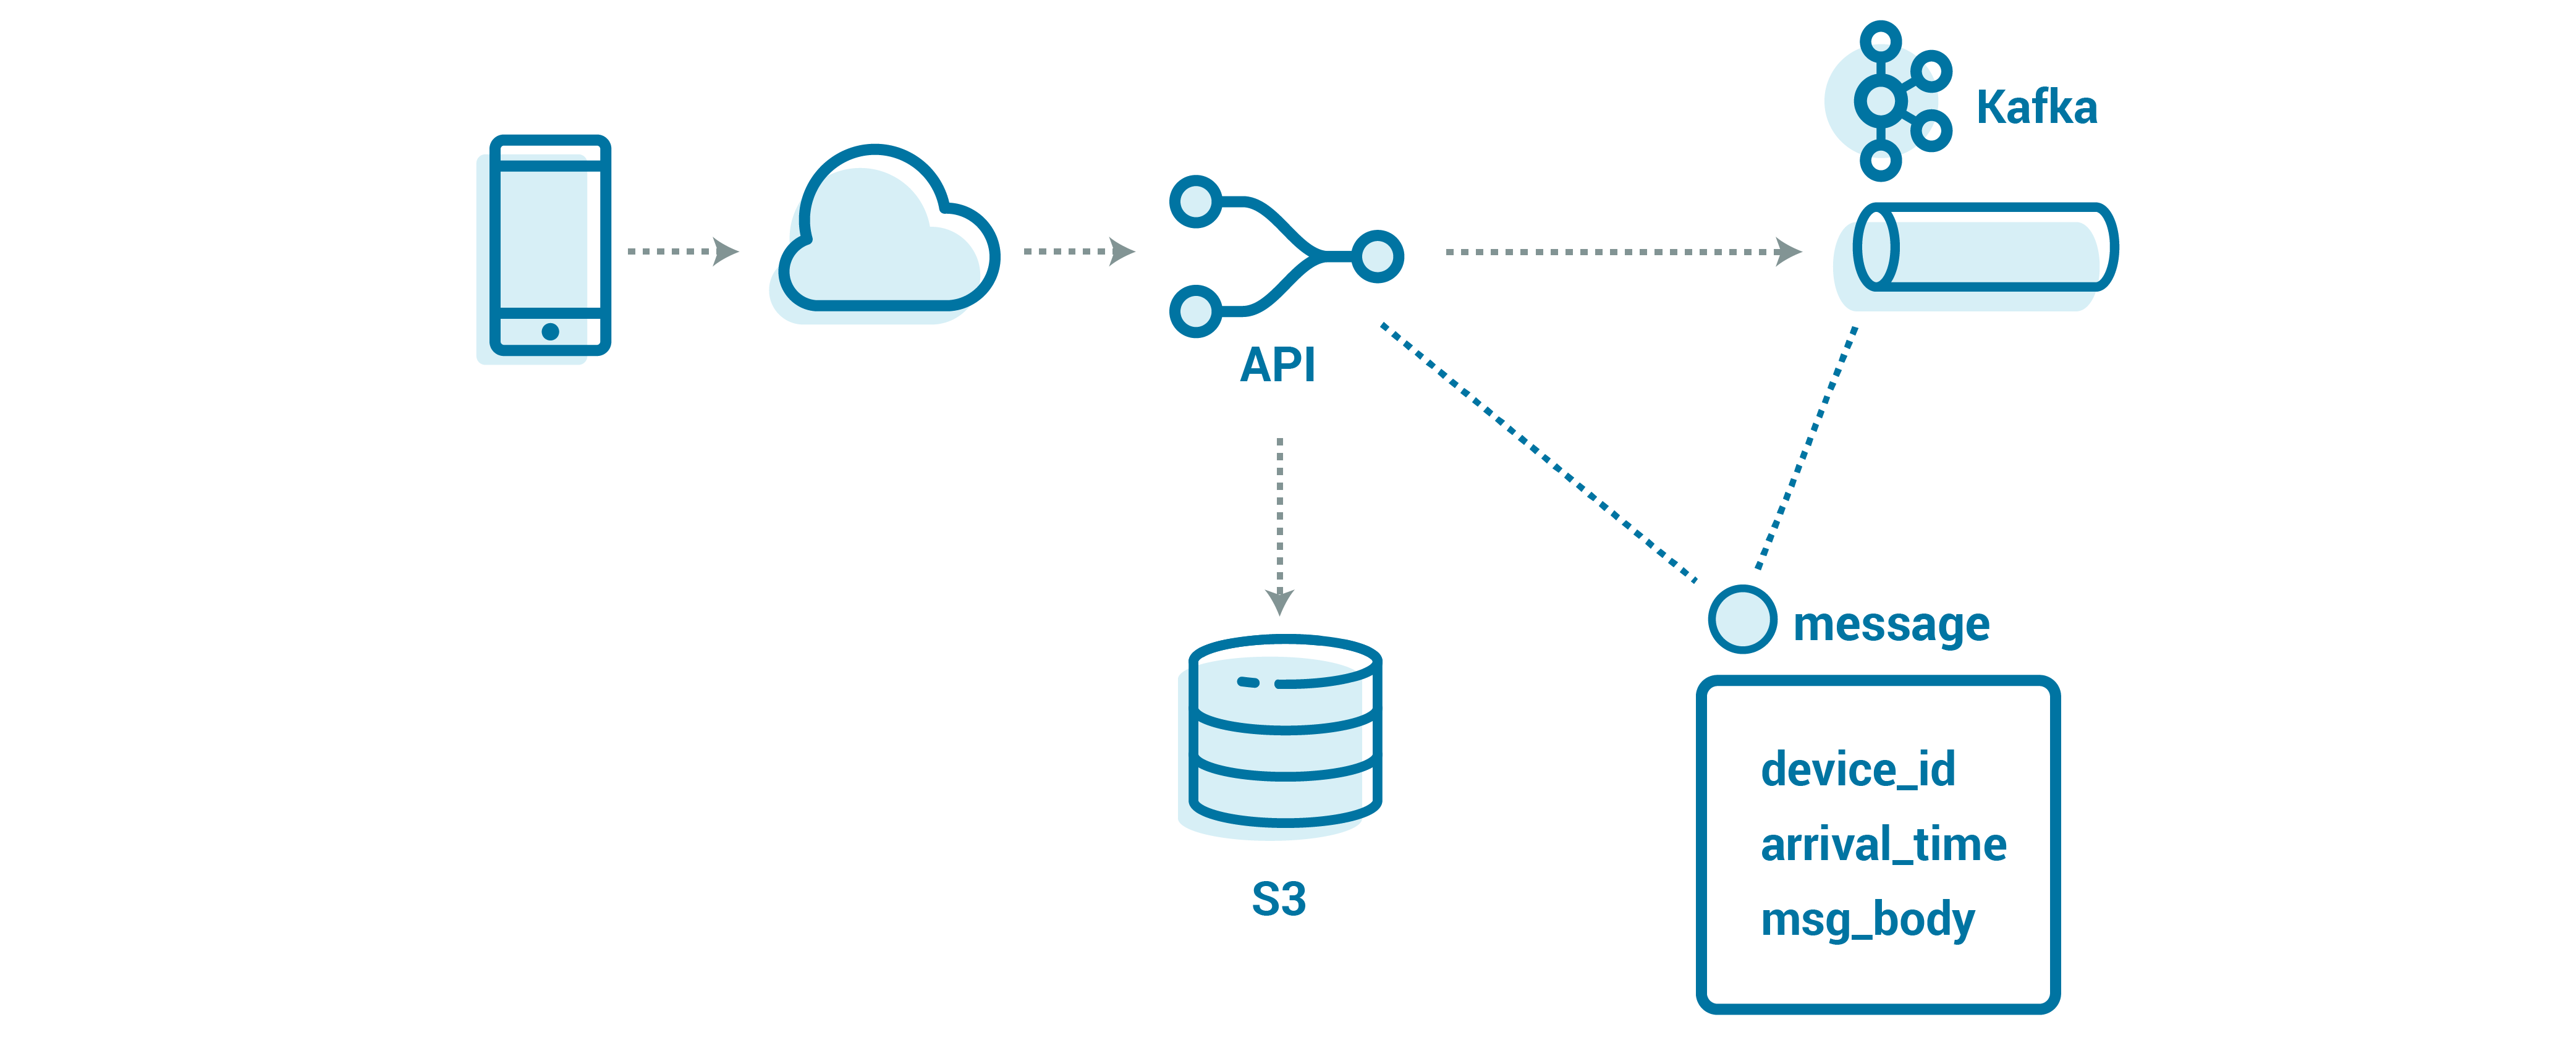
Since we already have an API layer for ingest, it’s relatively straightforward to implement our own logic that uses the payload size to determine where and how to store the message—by value for small messages or by reference in an external store for larger ones. This also gives us the flexibility with our partitioning to support different use cases without the extra mental overhead of remembering to handle chunking; all of the streams can look the same, regardless of priority, message size, or volume. While we want to be careful not to put too much complexity into the API layer (so that it can be stable and fast), what we’re doing here adds a relatively small amount of complexity.
Even given the additional overhead of multiple backends, the idea of an external store for larger messages is starting to look pretty good. If you are already on the cloud, then an object store, such as Amazon S3, is known for reliability and durability, with little operational overhead. S3 is not a POSIX filesystem but rather a blob (binary large object) store—this is fine for our use, because we just need a place to store the message and a reference to get that message back later.
Furthermore, S3 has become the de-facto blob store API that is supported on other platforms, meaning that we could even move our ingest API implementation to a different vendor or on premises in the future. S3 also allows us to set the time to live (TTL) on the bucket, so that it will automatically clean up messages that don’t get delivered in failure cases.
Using an external store, our API will write messages into Kafka with a small wrapper that includes the data (or the reference, for large messages), as well as some helpful details about the message:
Message {
  string device_id;
  optional string reference;
  optional bytes body;
}
Our event key (used for partitioning) is arrival_time_millis.
Parsing the stream
Now that we have our raw data in Kafka, we need to make the data easier to use by consuming applications. We could put the data directly into a database or an object store (i.e., a data lake), but other teams might also want to access the data as a low-latency stream of events. It’s also helpful to separate the logical processing stages so that we can better isolate the operations and scale stages independently. For this, we can create an intermediate, canonical form of the data, agnostic of any particular processes. This canonical representation of the data is then the single interface for all downstream operations. We call the function that transforms the source data into this form the parser. We can embed the parsing logic into a stream processing tool (Kafka Streams or alpakka-kafka are two great choices) to make the canonical data available with low latency to downstream consumers.
We could combine the parsing logic with the storage and downstream topic logic, but that lumps a lot of complexity into a single stage. It also couples the processing throughput to the throughput that the storage system (i.e., the database or data lake) can support.
There are a number of benefits to this approach:
- Reduced complexity: There are fewer interactions and interfaces, so each component has limited concerns and clearly defined scopes. This also helps limit the emergent complexity of the system, because no one piece does too much—it’s just a combination of clear, succinct components.
- Operations: For example, if you are writing to a database and the database is having issues, you know that you can just re-run the necessary processing stage that writes to the database once it has recovered.
- Independent execution: Even if the database is down, you can continue to run the parsing stage to generate the canonical data, making it available to other consumers and generating a backlog, so that when the database is stable again, you can quickly catch up.
- Workload isolation/independent scaling: There are a number of implicit throttles for each component. If the database is not able to handle the peak volumes, you can reduce the number of consumers, effectively slowing the rate of consumed records and easing the load on the database. Then, as the load comes down from that peak, you can continue to write at a healthy rate—without breaking the database—and catch up on the backlog that had accumulated during peak times, all without affecting any other stage.
This canonical format is also very helpful when exposing the event streaming data to other teams in the organization. It helps limit the complexity exposed to the rest of the organization; not everyone needs to be able to run their own raw data parser or know about the large message store in order to get the data. We can also ensure that the schema in this parsed “canonical” topic remains backward compatible and does not break consumers.
Here, the Confluent Schema Registry can be very helpful. It’s designed to be the central place to track the schema for each topic, making it easier to understand and interpret what data is on those canonical topics. It also comes equipped with configurable per-topic compatibility—Forward, Backward, or Full—so you can know that the data remains readable. As a nice bonus, the source-available libraries can also leverage schema by reference, allowing you to pack Avro messages much more tightly than they usually get serialized. All in all, it’s a slick piece of infrastructure.
Defining the parser stream processor
Depending on the data formats in which data arrives from devices, we will likely need to build some parsers for standard formats, such as JSON and CSV. They should be pretty quick to spin up and will solve many teams’ problems out of the box, but you should definitely look at your common cases—and talk to your users before running off to implement these standards. At the same time, we will also likely start to have teams that produce server-side events (i.e., those from within our network, not IoT devices) on our platform as well. While the common format is often just JSON, there is rarely an excuse for server-side teams to not produce messages with a declared schema (for example, using Avro); they have full control over all the message producers, and there are libraries for the common formats in almost any language.
In my Kafka Summit talk, I suggested exposing a parser interface like this:
parse(byte[]):: Iterator<Map<String, Object>>
You take in bytes (the message) and produce a number of events. The processing framework handles the rest of the magic of turning those events into canonical messages, sending them along and committing progress. All teams need then is to select an existing parser—or they can build their own to support their custom formats.
This interface also has two failure modes: one that skips the message (it is known to be bad), and one that fails the message entirely (forcing the stream to retry). If your parsing is dependent on external state (hopefully not!), this allows it to retry and, if built properly, back off from the external store. If not, then you get resilience to cosmic rays and a free retry. However, if the record really is busted in a way that the parser cannot understand, it eventually blocks up the whole partition and should end up alerting the operations team.
This interface is pretty close to as generic as you can make a parser interface: data comes in; messages go out. It is also something that users can easily understand and is surprisingly extensible, as we will see later. In Kafka Streams, it is actually quite easy to build a wrapper around a parser interface that supports these semantics:
StreamsBuilder builder = new StreamsBuilder();
builder.stream(conf.getSource(),...)
  .transformValues(new ParserRunner())
  // we get an iterable out, so we need to flatten them to single events
  // exception here stop the processing
  .flatMapValues(t -> t)

class ParserRunner {
  private Parser parser = ...
  public Iterable transform(byte[] value) {
  try{
    return parser.parse(value)
  } catch(Exception e){
    // its OK for the parser to fail when generating the iterator, we just
// skip the record. It would also be a nice place for metrics/monitoring return Iterators.empty(); } }}
By making the interface available to others, you can start to bring some sanity to what the stream processing team manages and what the firmware developers (that generate the events) have to worry about. As the firmware developers evolve the data formats or add new streams, they have more power to control their own destiny, rather than waiting on the ingest team to write and roll out new code.
Of course, there starts to be a dance around if the code should continue to support older versions or if it is just easier to spin up a new topic and new parser for the changed data format. We have that long tail of devices, so we still likely need to keep the old format around for quite a while; devices can easily be online sending data but not get firmware updates, for many reasons.
It’s really up to you which burden you want to bear—the code complexity and overhead of differentiating formats or the operational load of managing new topics and data parsing pipelines. It is important that the stream processing teams be involved with the rollout process (particularly for large changes), as it can affect not only the stream being scaled but also the existing pipelines, and potentially, all of the data that the company is getting from devices.
Managing data type explosion
In any large organization, you are regularly going to get new data streams. Either new device types are added, new sensors are added to existing product lines, or even new data is collected from existing devices (e.g., they came equipped with hardware for which there was not yet firmware written and with which to collect data).
There are a couple of design approaches that we can take to enable our solution to adapt to new streams:
- One topic per stream type
- One topic for all types, with parsing performed on the fly
- One topic per device type (a middle ground)

In reality, you are likely to see a mix of these possible stream organizations. If you have a common data format, it can be tempting to write all of the data from all devices to a single stream. This lets you balance out any differences with just the sheer volume of data (relying on the sheer number of messages to approach a true uniform distribution). At the same time, this prevents you from being able to throttle any particular stream up or down. So it does make some sense to pull out some of the streams that are particularly important into their own topics, possibly still grouping by device.
At the same time, within a particular model, you might want to split out different device groups. For instance, we might want to break out our enterprise customers’ devices from the consumer devices; enterprises often have much stricter SLAs. Or we might want to pull out development device streams from production device streams. Development devices can generate orders of magnitude more data, due to in-development firmware or just frequent use, skewing our uniform data distribution and again impacting our ability to reason about the steady state changes.
Ultimately, this will be an evolving conversation, based on the organization’s requirements across different device types and customers.
Beyond just how to organize these raw streams, we also need to consider ownership of the parsing itself. The streaming team could try to support all possible formats, support a limited subset, or allow parsing to be pluggable. By owning the parsing and managing all possible formats, there is the risk that the team becomes a bottleneck for new data types for the entire company. On the other hand, pluggable parsers allow teams to control their own destiny, but require the streaming team to expend large amounts of energy making the pipeline resilient to these custom parsers and exposing metrics and knobs to the external teams for managing these streams on their own.
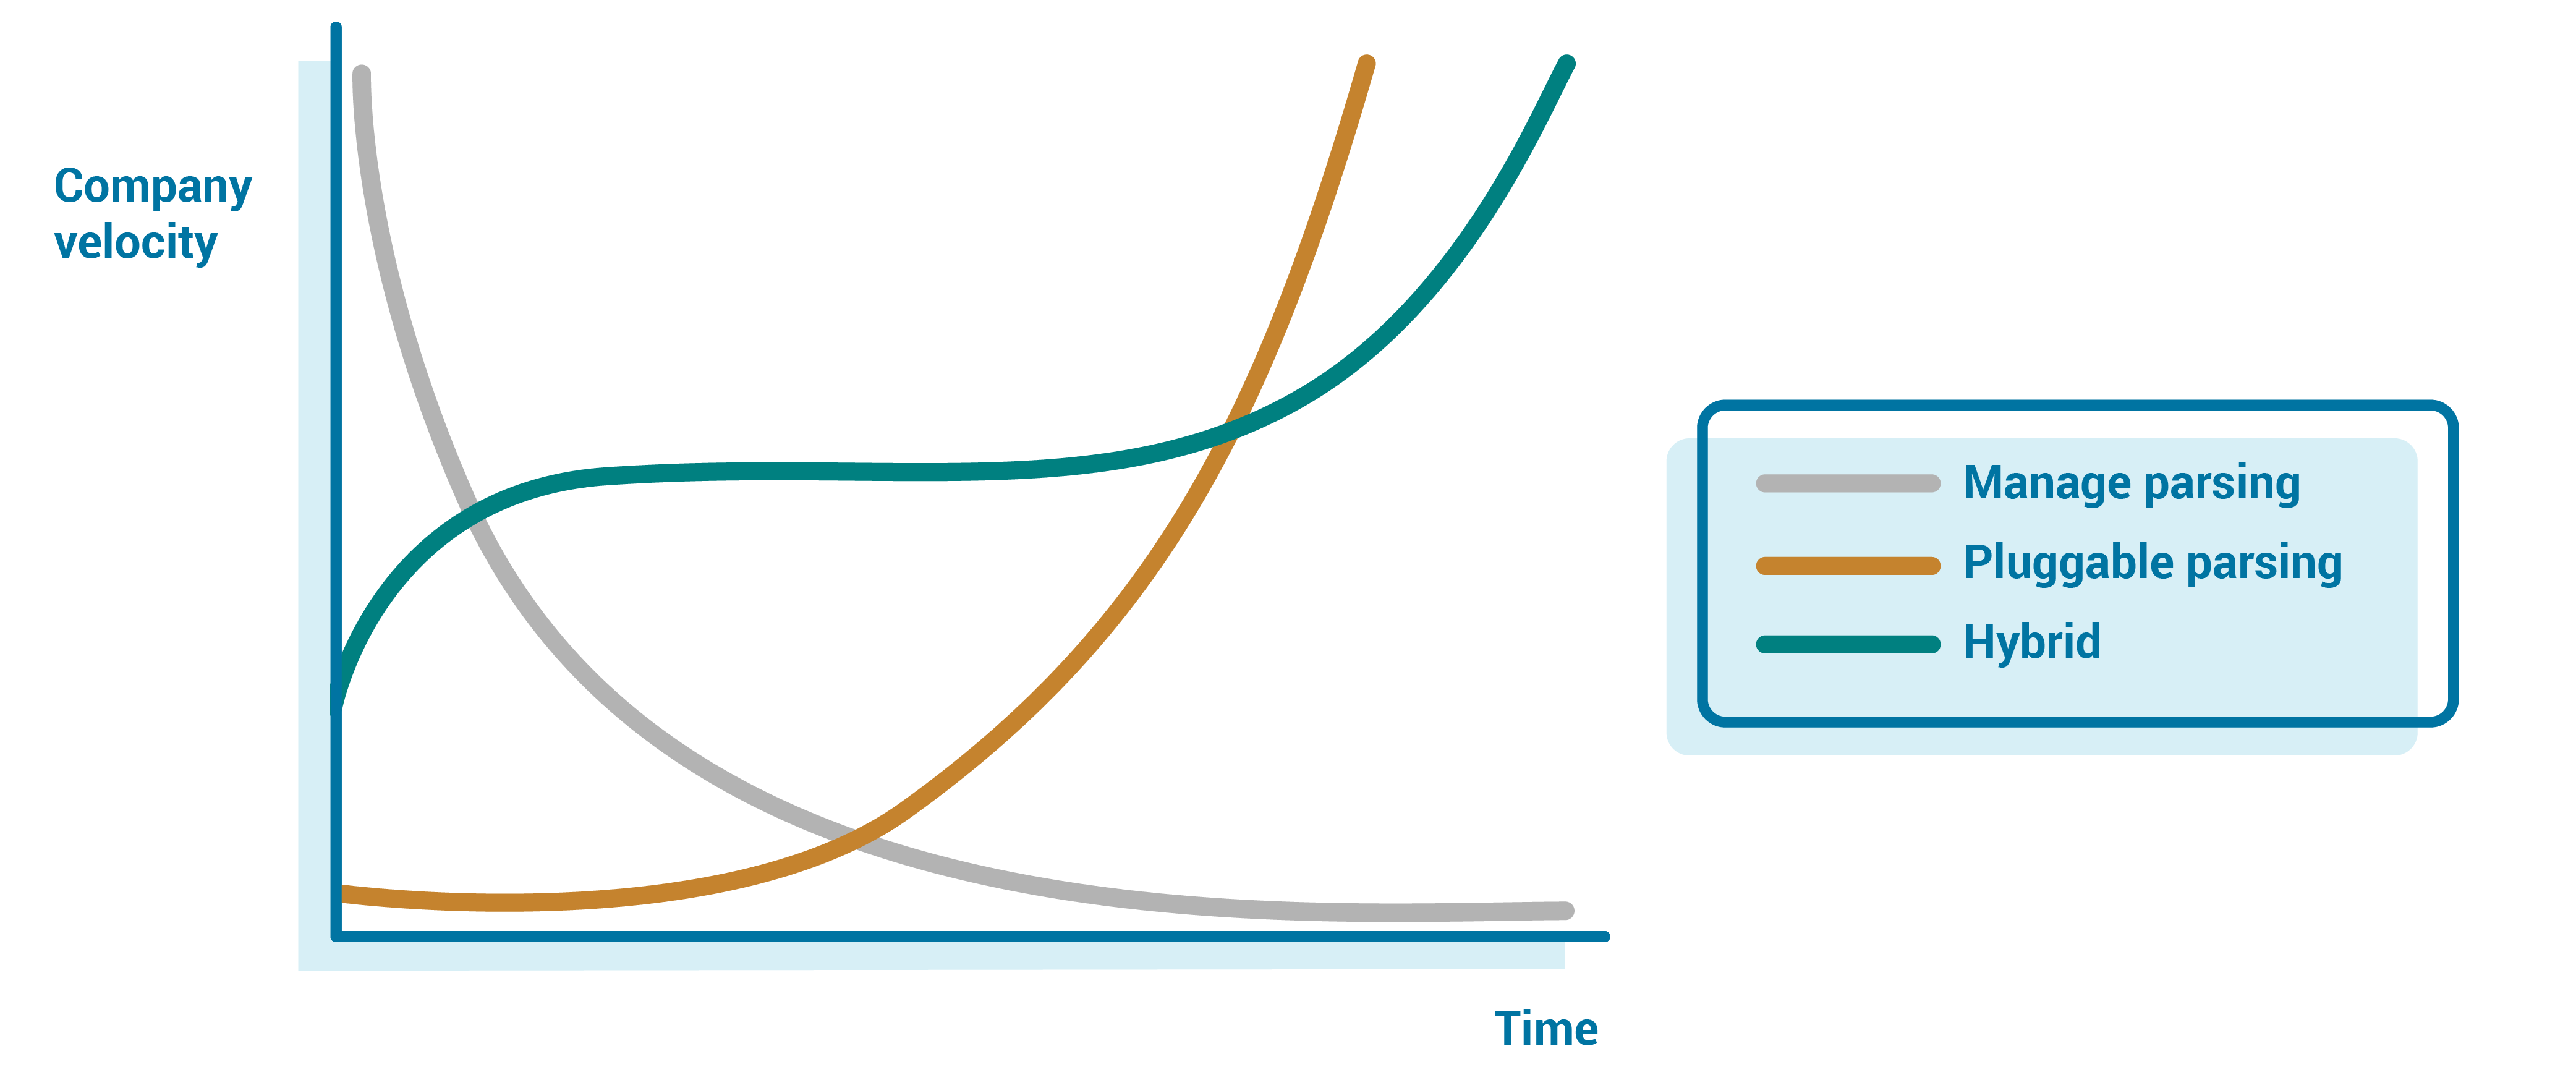
In the early days, you are likely to be more vertically integrated—having the team handle parsing for the single format or limited number of formats—so the team owns the parsing for a handful of topics. Even at scale, owning some of the larger streams will help the team catch the corner cases, ensuring that the average case works smoothly.
However, owning all possible parsing does not scale long term. Beyond the “core” streams that the team owns, moving to a pluggable model allows you to scale and place the development and knowledge onus on the teams that have a vested interest in the data. This allows you to give teams all the tools they need to control their own destiny, removing the bottleneck of the event streaming team, but also putting ownership on the team with the most domain knowledge and vested interest in solving the problem.
Dealing with big messages in the pipeline
As we discussed above, there is not always a single distribution of message characteristics. We quite often observe a long tail, not just in the frequency of seeing a device or number of messages, but also in the size of individual messages. For the most part, we will likely be able to trust that the limits specified by our firmware developers match the limits that the devices actually use when sending data to us. That said, hardware devices are often known to occasionally go a little bit wonky for whatever reason and, in this case, you will regularly see single messages that are much larger than you expect. We saw previously how our parser can deal with storing large messages, but what about keeping the pipeline flowing when dealing with them?
How you handle large messages will depend on your requirements, as well as the particulars of your parsing implementation. If the parser is super fast, then maybe just handling the big message is fine. Most likely, it will cause some backup in the processing pipeline. This means that one of your partitions will be blocked as it processes the large message; it sometimes takes only a few of these at the same time to make things escalate to the point that you’re being paged for an outage. And at that point, you really can’t do anything but wait; even increasing replicas—scaling up horizontally—can roll back all the good progress your parser is making in getting through those big messages as your consumers rebalance, making you fall even further behind.
A coarse approach could be to just truncate these messages to the length that they should be. And that might work pretty well if the device is malfunctioning and sending junk data that’s not worth your time to process and store.
But let’s assume that you want to keep all of the data.
You could try to parallelize the number of records you are parsing at the same time. This can actually go a long way toward minimizing the risks of big messages. While you are working on the first big message, you can in parallel be working on the next N messages, so that when the big message completes, you are also ready to commit those following messages. If you have a number of big messages in a row, you are dramatically reducing the user-visible parsing time, hiding it within your parallelization. At Tesla, my day job, we use alpakka-kafka on akka-streams to build our event streaming pipelines, designing our parser structure to map closely to this diagram.
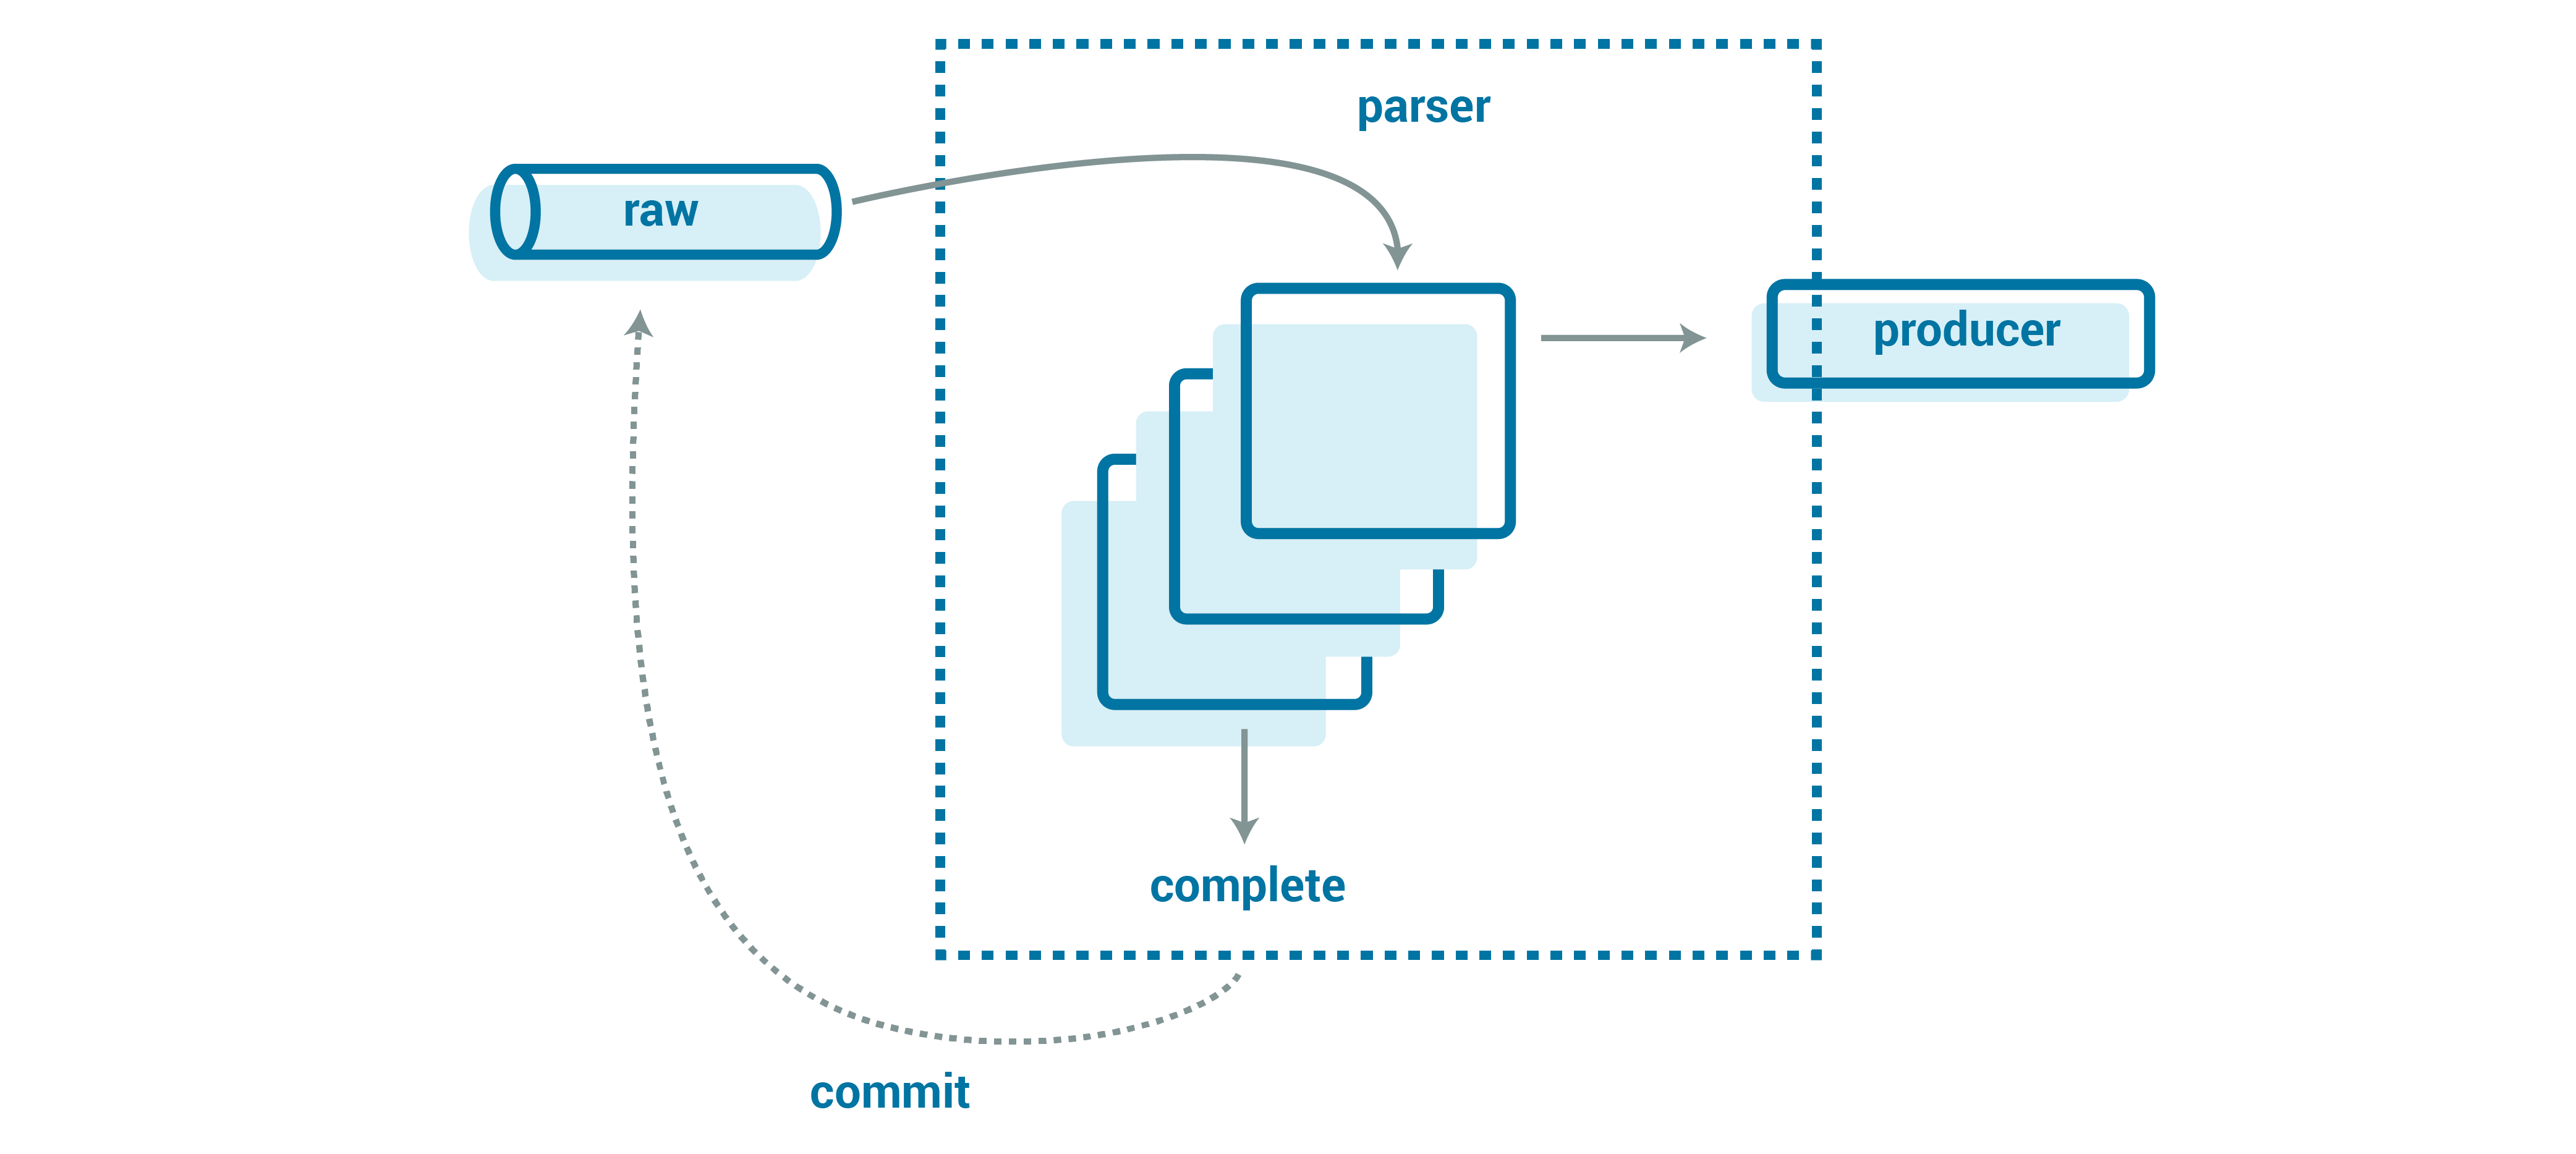
In simplified Scala, it looks like the following:
val (parserParallelism, producerParallelism) = (5, 10) // constants
val producer = new KafkaProducer(...) // create a re-used producer
val parser = Parser(config) // create the parser
val stream = Source(kafka) // a stream of messages from kafka
  // each parse happens in parallel
  .mapAsync(parserParallelism)(message => Future {
    val iterator = parser.parse(message.value())
    Source(iterator)
      .map(toCanonicalAvroRecord)
      // each message can produce records in parallel to a destination topic
      .mapAsync(producerParallelism)(producer.produce)
      }).forEach(record => record.commit())
Here, messages are parsed in parallel (the first async block), creating an iterator of events. These events are also produced in parallel and then finally committed. akka-streams’ mapAsync ensures ordering while also giving us intra-partition and intra-record parallelism; we can parse a number of messages in parallel and then produce—also concurrently—the canonical Avro records.
You may recognize the risk here too, though: What happens when the consumer fails (or even just rebalances) while parsing a large number of records in parallel? Now you have to re-parse those records, because you weren’t able to commit your progress. Perhaps you start to consider using some sort of distributed state to track whether a message had been parsed, even if it wasn’t committed—basically rebuilding Kafka’s “committed” logic but for your special case. However, that state just adds complexity, memory, and (in many cases) headaches you don’t need; stateless is already hard enough. With appropriate tuning, this should only rarely be an issue.
Instead of distributed state, maybe you consider buffering the progress in memory rather than sending the events downstream. Unfortunately, that could blow up the memory on your consumers, particularly if you are highly parallelized and handling large messages. Buffering also means that the small messages caught in this traffic jam don’t make their way downstream in a timely fashion, which could have implications if you prefer fresh data over a complete view of the data.
I find that in practice, if you have tuned your consumers appropriately, these failures/restarts rarely happen enough to make a material impact; you just let them happen and assume that your downstream can handle the duplicate records that result from re-parsing uncommitted messages.
Instead of trying to process the messages as part of the pipeline, but still parallelizing them to ease the pressure, we could get the large messages out of the way immediately. Rather than piping them into our usual parsing pipeline, we can divert them to a “slow lane” topic right at our API. In this slow lane, you would just have these big messages, against which you could run a separate set of the consumers that are specially tuned to process the logs more quickly and with less stringent latency SLAs. The latter point is important in ensuring that you don’t get paged. 🙂
We could make the slow lane choice up front when the API receives the records. However, that puts our goal of landing data durably and quickly at risk as we load more and more logic into our API. Instead, we can defer it to the parser itself. The parser is given a time limit to parse all canonical events from the message. If it doesn’t complete in time (maybe with some wiggle room), then it stops attempting to parse the message and just enqueues the message into our “slow lane” topic. This helps keep our API simple and offloads to the backend, where we can be more tolerant of issues like retries and large messages.

How you handle these big, slow messages all depends on your particular use case and requirements.
Thundering herds and high-priority events
With a large number of devices, we are likely to get thundering herds: groups of devices or notifications that unintentionally synchronize, leading to huge volumes of events flooding our system. If things get really bad, this could even look like (and have the effect of) a DoS attack—though it is caused by emergent behavior of the system as a whole.
For example, suppose we prefer to have our devices upload data over Wi-Fi to save on cellular costs (IoT companies themselves often pay the cellular data costs). This can cause herding in the late afternoon and early evening, as users get home from work and their devices start uploading to their home Wi-Fi. Now we have to plan and provision servers for this, which has become a daily occurrence and could ironically end up costing the company more money than expected from the Wi-Fi preferred cost-saving measure.
It’s important that we successfully handle these floods of messages, as some messages could include critical data that must be landed and processed quickly. Here, we can introduce the concept of a fast lane for this data, with either a raw topic or a canonicaltopic that redirects from our generic catch-all topic. Similarly, we would want to set alerting more rigorously for this processing, so that we never fall too far behind.
This fast lane could be complementary to the usual stream of messages that handles slow lane redirection (as described above), or it could just be the de-facto handling that all messages are assumed to be fast (the risk being, of course, that the assumption is wrong, which could delay the critical messages from landing or getting processed).

Adding a separate endpoint in our API does add complexity but could be worth it to quickly get these high-priority messages into their own topic and processing stream. An alternative approach could be a small intermediate topic that just looks at the message metadata or envelope and reroutes it to the actual raw topic. The trade-off here is that now we have another event streaming application that we need to manage and scale, which could break or get backed up.
Bucketing event time
Up to this point, we have described how to deal with getting data from the devices into a canonical format in Kafka. After data comes into our system, it gets partitioned by the arrival time; this leads to a uniform distribution of messages across partitions, ensuring that the system can scale horizontally and is insulated from “thundering herd” problems. The next thing we need to consider is how to structure the downstream partitioning—the partitioning scheme for the canonical topics.
When analyzing a fleet of IoT devices, changes over time are critical to consider. However, analysis is often still device centric; you might ask questions like, “How did some value change on a given device over the last two days?” Or you might inquire, “What is the average across the fleet for the last month?”
For some of the streams, we could get a relatively uniform event distribution by partitioning on event_millisecond—the timestamp of the event itself—rather than on the time when the message was received. When we partition data by timestamp, events from a given device for even a short time range will land in every partition. This can work for streams that are relatively small, for which consuming all of the partitions at once is acceptable to answer questions about a given device.
However, consider a case where we have a sharded database storing our event stream data. It is likely partitioned on the same keys by which we query device and time. When we have multiple database writers (necessary to achieve higher throughput when we have many partitions), partitioning on event_millisecond means that every single Kafka partition is going to have data for every single database partition. Similarly, if we wanted to read from Kafka directly, we would need to read from every single partition to compose even a small window of history for any single device. For large volume streams, this ends up requiring a high degree of sophistication that could easily overwhelm even the most scalable of databases.
A simple approach for getting contiguous event streams is to partition on devices’ UUIDs. This ensures that the data for one device always ends up going to the same partition and (retries and restarts aside) in the same order in which it arrived. This can make life very easy for downstream consumers, as they only need to read a single partition to get the history for a device.
At the same time, there is a higher likelihood that our canonical topics will get overwhelmed when a handful of devices send us huge volumes of data. This could be part of normal business operations as a device comes online and sends all history from when it was offline (at scale, a number of devices every day will do this). Alternatively, it could be a “last gasp” before the device fails to ensure that all of the diagnostic information necessary is available, but that could easily be quite a large amount of data on its own.
A consistent UUID-based partitioning scheme is likely to lead to a lopsided distribution of data to partitions, slowing down the ability to write as brokers are overwhelmed, and impacting downstream consumer throughput. Even with a truly huge amount of devices theoretically smoothing this distribution out, we are still going to have to contend with the same challenges we have seen already. We will still have firmware rollouts, new data streams, and new device types, so we can’t count on sheer scale here to smooth out our canonical topics.
Stepping back, either for cost savings or for efficiency reasons, devices are unlikely to be constantly connected and sending a stream of events. That means that we are going to see discrete event windows per message; each device will send us a chunk of data that covers a window of time.
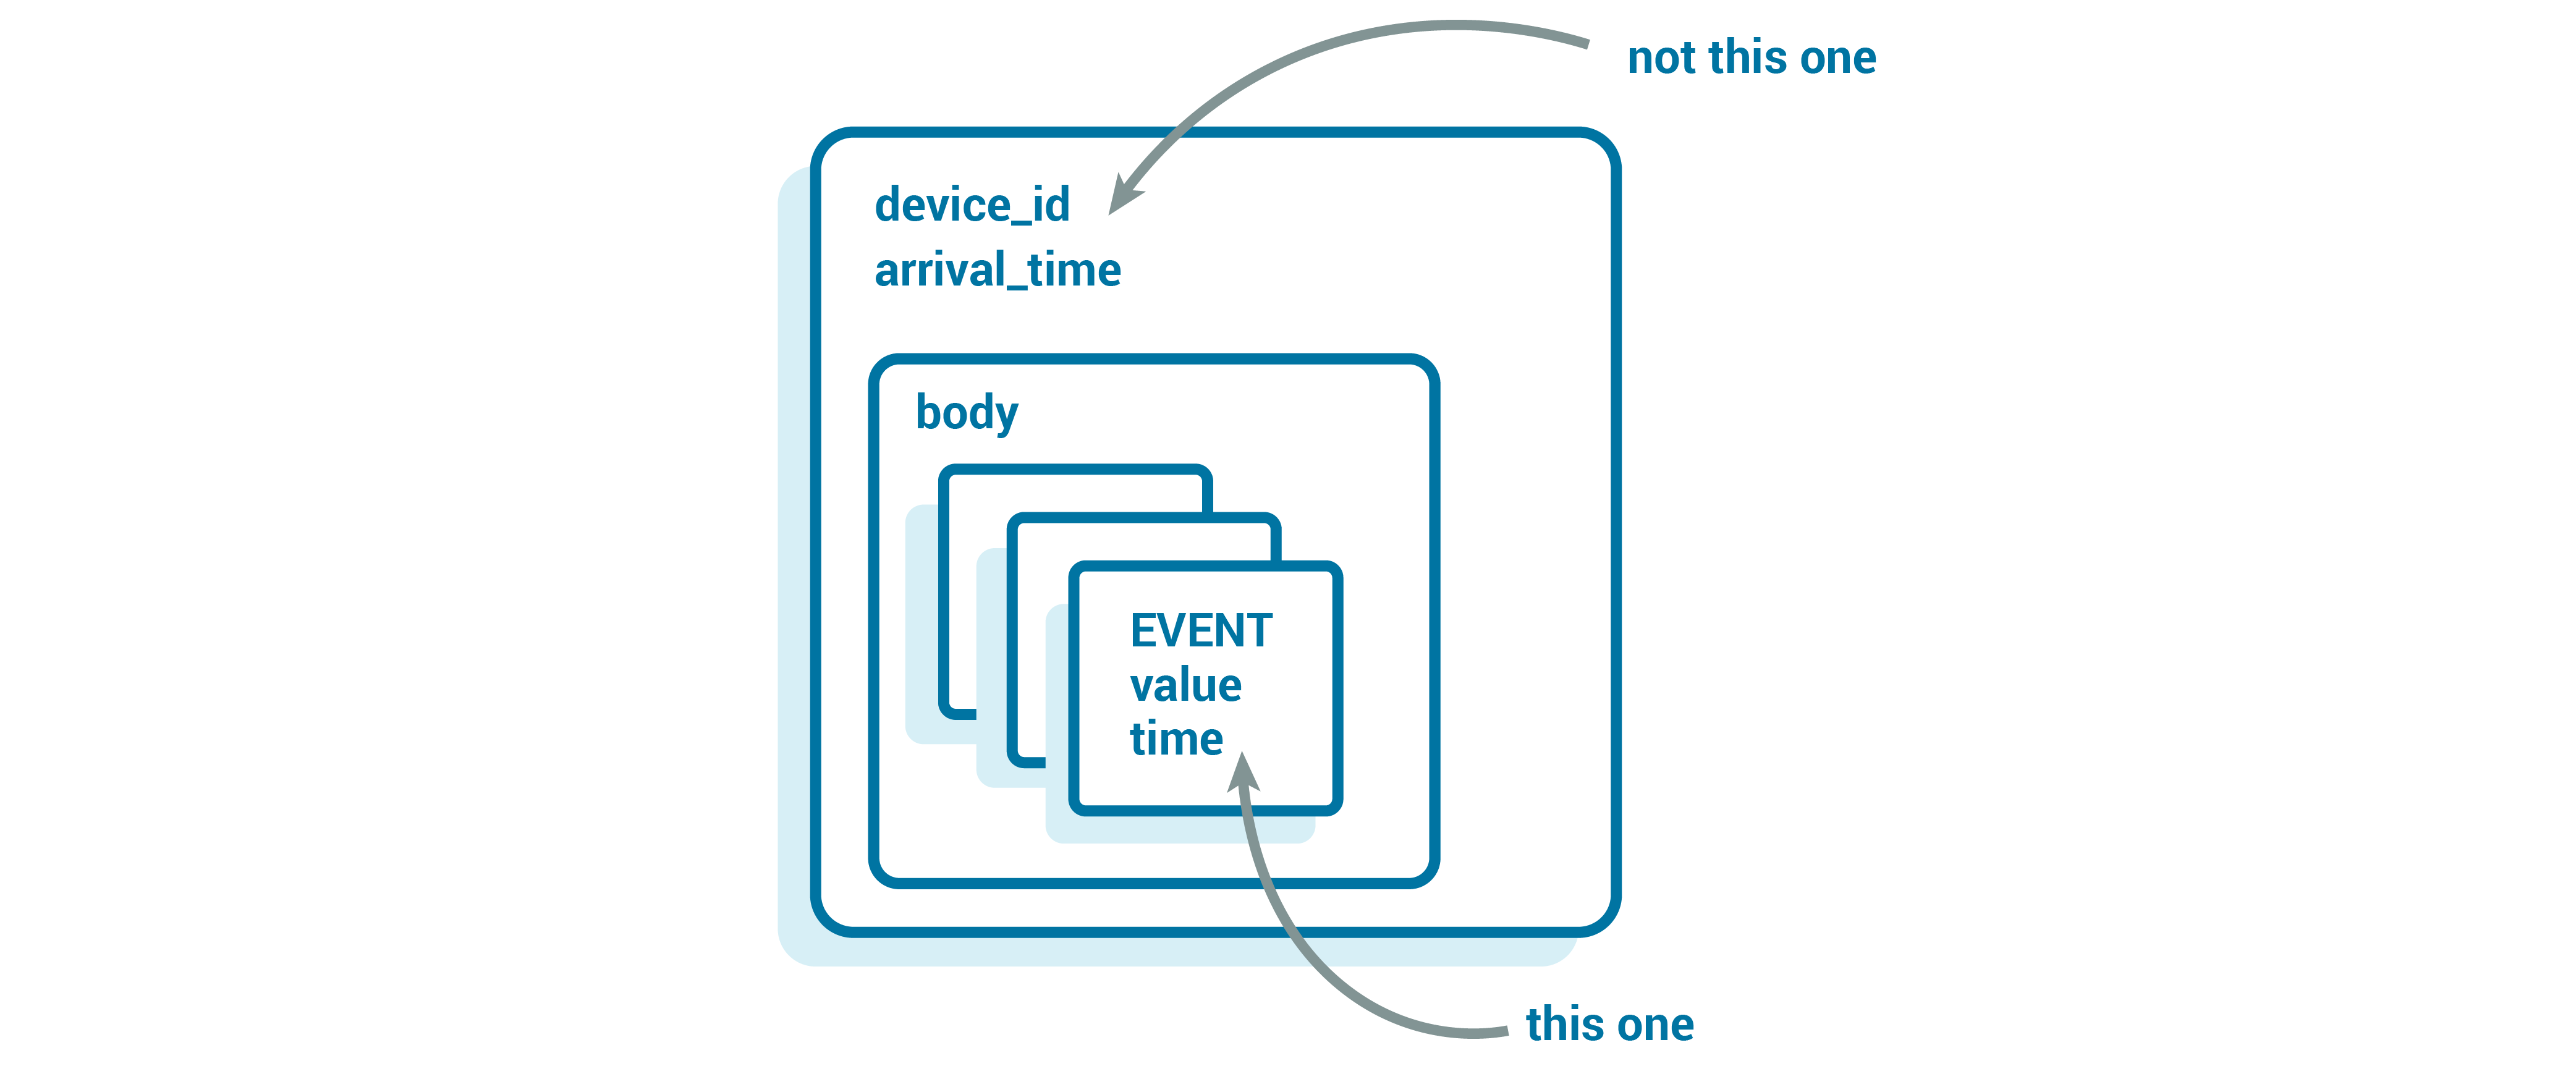
So we can map these chunks into time windows that are convenient for our storage system. Our canonical topic’s partition key can be something like UUID + time_bucket, where the bucket is dynamically generated, based on the event time.
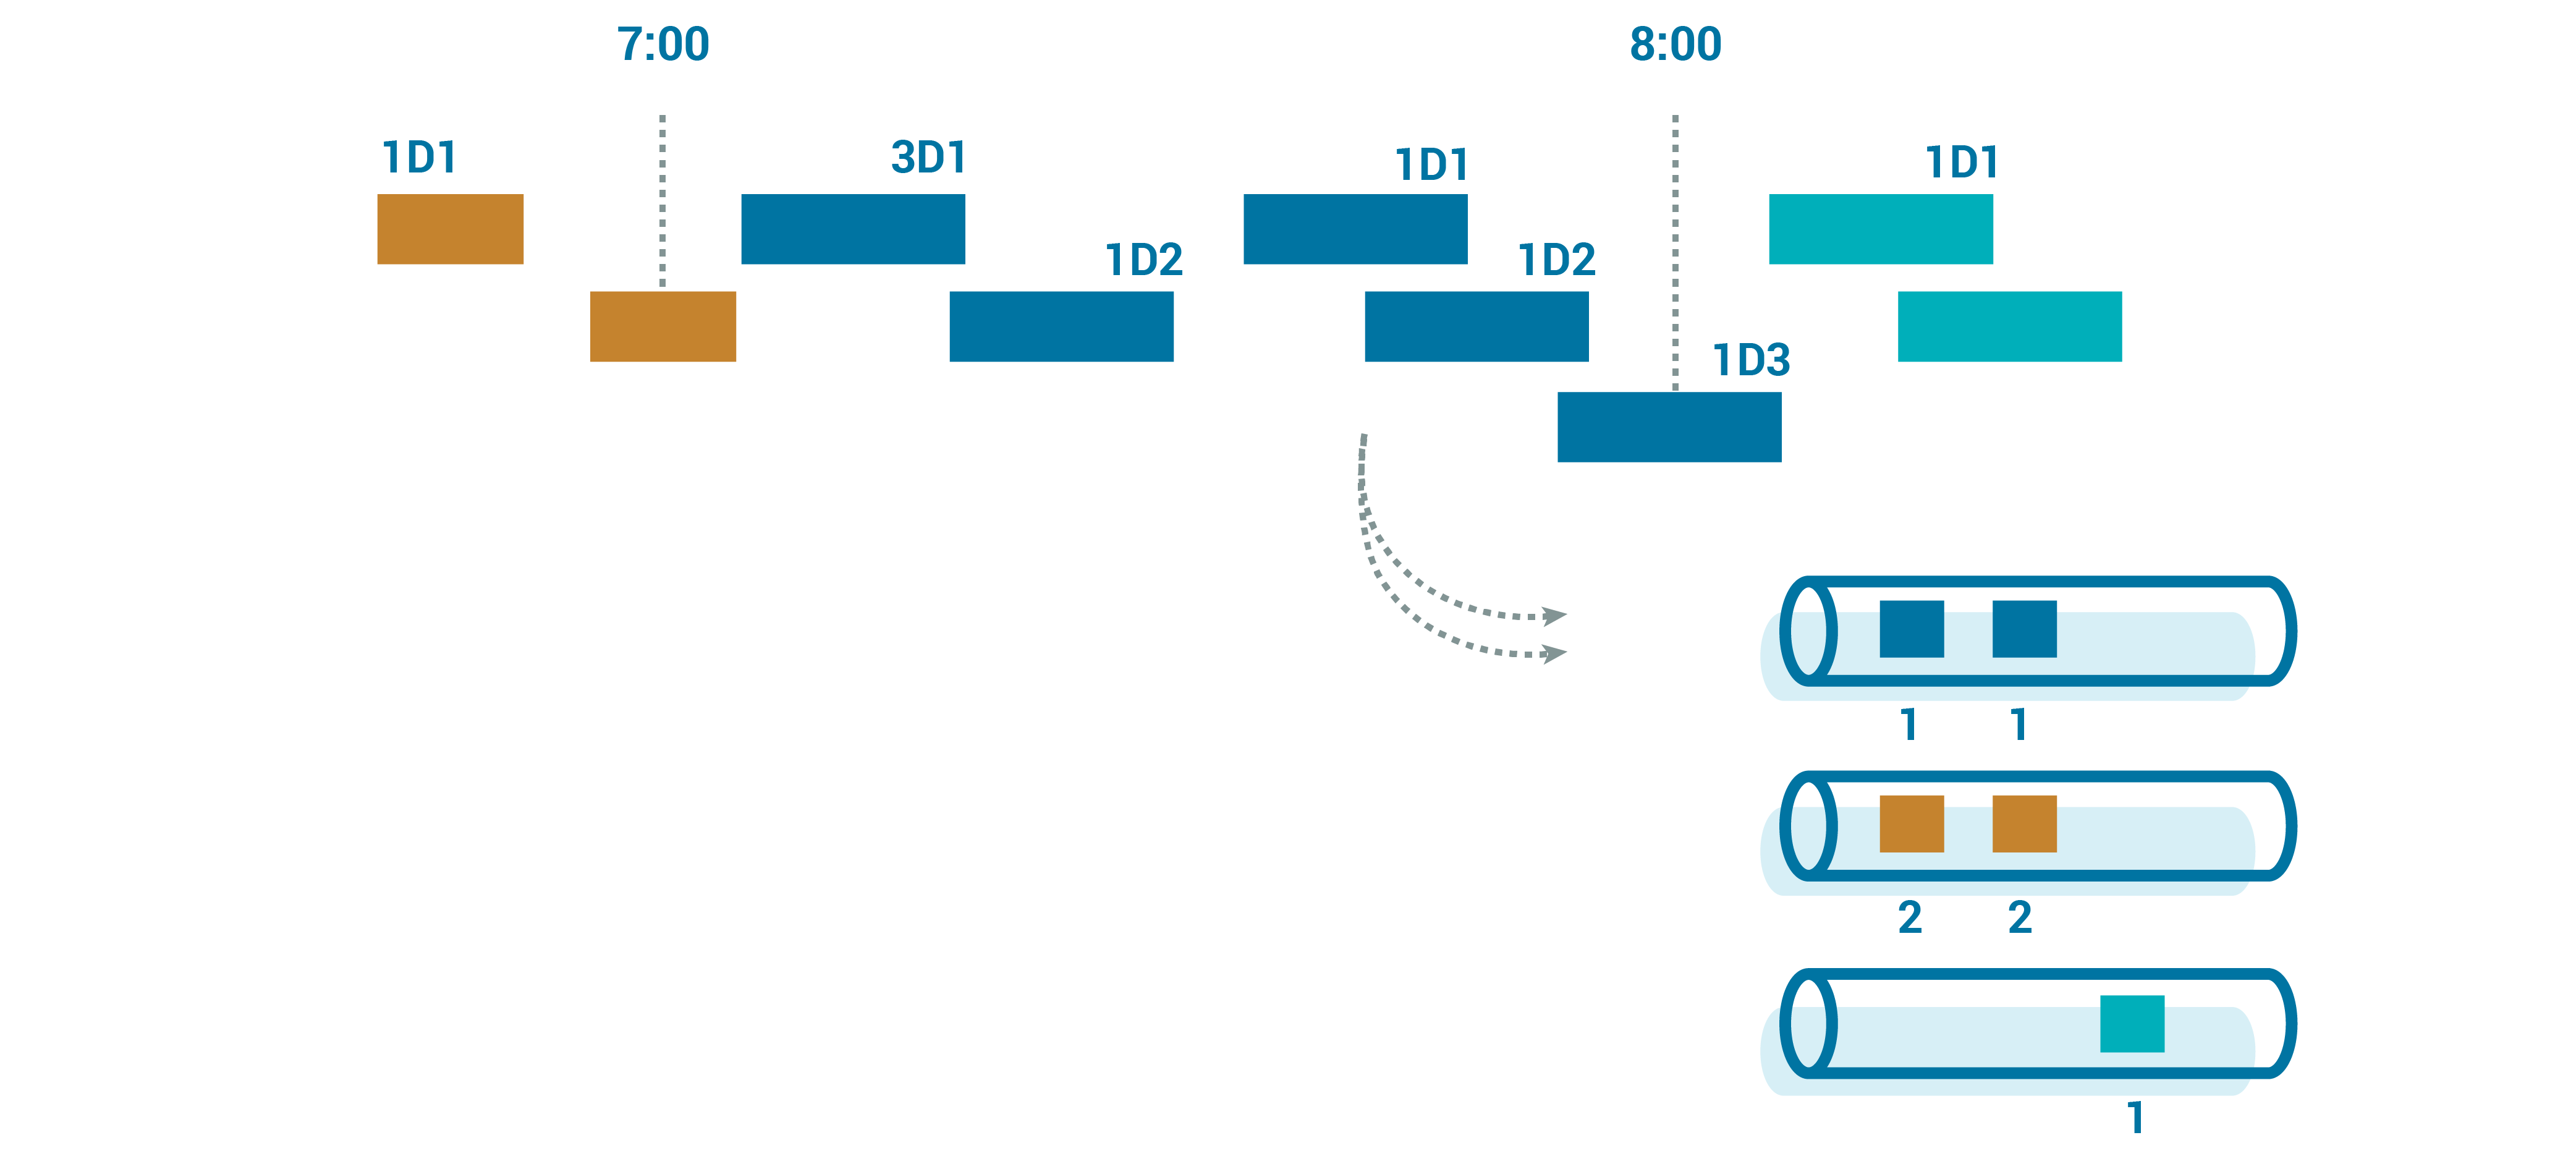
When we read from the canonical topics, we continue to get the devices’ data grouped together for large amounts of time, but we avoid the risk of DoS-like data floods. This can be incredibly useful for streams that have to be processed quickly but are also the ones most susceptible to “thundering herd” risks.
When you have a large fleet of devices to manage and analyze, it becomes important to understand how much of the fleet you are really getting for any given day. Depending on the herding at different times of day, we could see 90% of the fleet daily or 30% of the fleet daily. If that percentage drops off suddenly, we will want to know that, too.
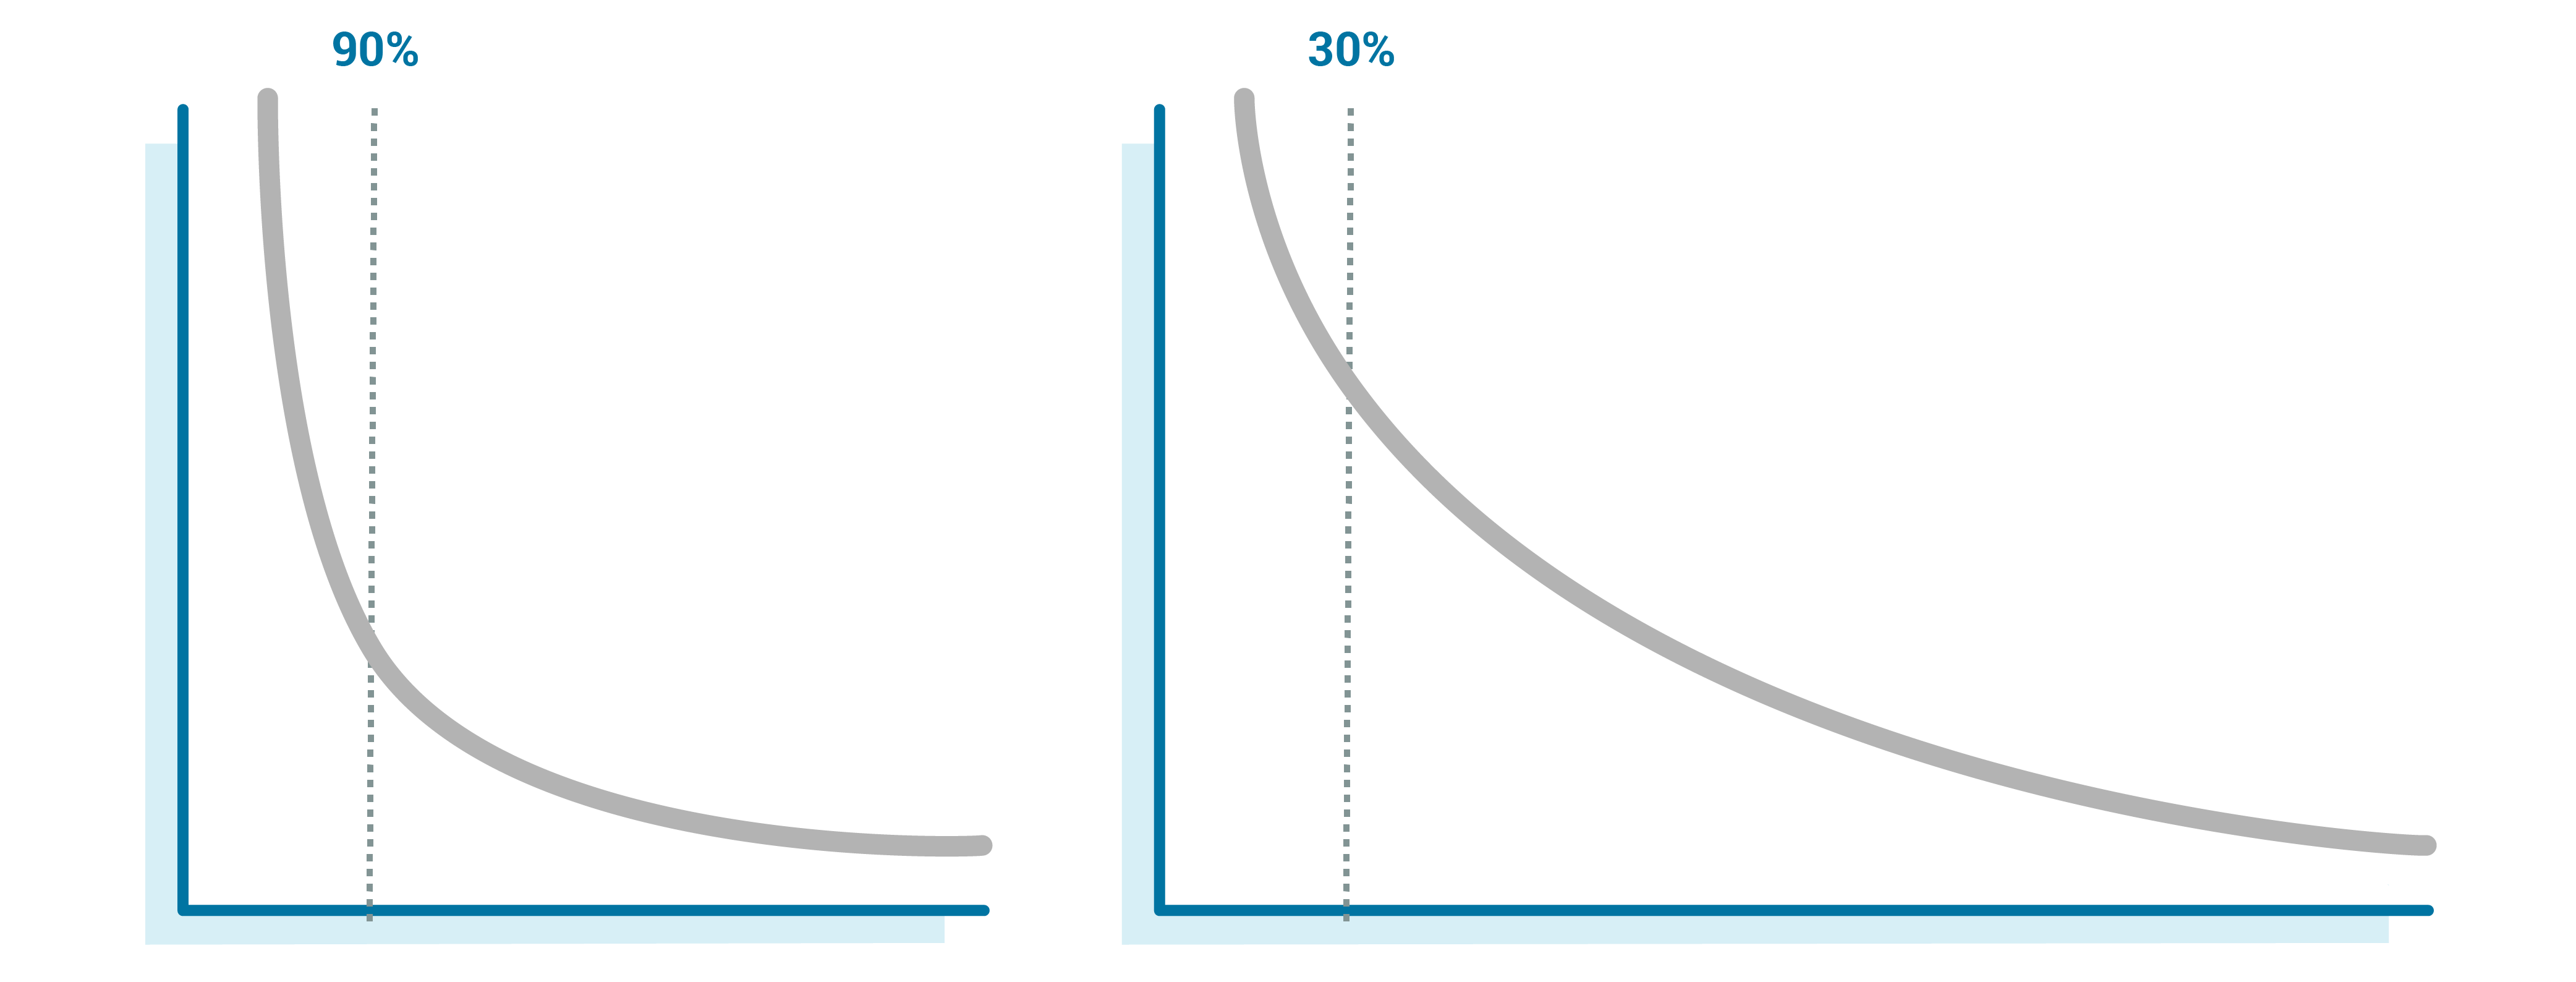
This is where a metadata stream is very powerful. It’s built on the same raw stream that we used for the standard raw-to-canonical parsing but tracks common event features, without fully parsing each message. This includes device type, device UUID, firmware version, time received, source topic, message size, and potentially message start/end times.

Once we have this data, we can perform powerful queries that help us understand the state of the fleet, such as:
- For how much of the fleet did we get data on in the last day? How about for the last two days or the last week?
- What devices have never sent data or are chronically late?
- How big are the messages?
There are multiple ways to materialize this metadata stream to answer queries. It could be another table in your time series database. Metadata about a time series is itself often just a time series. Elasticsearch, or rolling up the events in a data lake or in a technology like Apache Druid, could also work if you have lots of event metadata to collect and analyze.
The key with this stream is that the metadata is primarily generated separately from the standard canonical event parsing of the messages. The work we are doing is much smaller, both in terms of CPU and data generated, so it has relatively low overhead to add but also makes answering fleet-wide questions fast and cheap. For instance, determining the relative coverage for every device in your fleet could mean scanning petabytes to find a couple of devices, but the metadata could run gigabytes, no matter how large the large fleet and over many years.
Notice that I said that the metadata stream should be primarily separate—but not entirely separate! When the parser takes the raw data and writes it to the canonical stream, there are derived metrics that add to our understanding of the fleet. These metrics include the number of events parsed per message, the time to parse, whether the parsing was successful, and more.

What’s neat about the Kafka producer is that it doesn’t get pinned to one destination topic. We can give it messages for multiple topics, and it will happily pass them along. Since the record’s metadata is relatively small compared to the event stream, it is essentially “free” for us to add this additional metadata about the parsing itself.
Now we can answer questions on the quality of the data being sent from the devices: How often is it well formed? How good is the custom format’s compression in practice? This can also inform areas like the amount of parallelism we want to employ for large messages, because we can understand in real time how long we are spending on parsing per message, and then make informed decisions around throughput versus data duplication during restarts.
Taken together, metadata streams are powerful tools to help us understand how our fleet and how the stream processing stages are operating, in a relatively cheap way. Metadata doesn’t cost a lot of data storage or CPU for processing. You do pay an operational overhead for managing an additional stream, but the operational gains for the fleet and understanding of the stream itself pay back the benefits in spades.
Looking forward
We’ve talked about a number of different topic types: fast lanes and slow lanes, raw topics, and canonical topics. You can also mix and match any or all of these patterns to achieve your business goals and requirements, though it requires care to avoid building out a horribly complex set of dataflows, where you get fan-out and fan-in and build a system whose end-to-end service-level objective/agreements (SLO/SLA) are unreliable or impossible to calculate.
At the end of the day, managing these dataflows shouldn’t be the goal of the teams building out these tools and pipeline components. The end users, whose firmware generates the events and the analysts who look at those events are the ones who need to be empowered to build and manage these pipelines. And let’s be honest, these people don’t want to deal with debugging, provisioning, and scaling out their pipelines. That job belongs to the data teams.
This decouples the teams that own the data and the team that owns the operations and scaling of stream processing. External developers write the code (in this case, often just a parser) and wire the components together, while the event streaming team manages not only scaling the software but also scaling the operations of the pipelines.
The infrastructure should take care of all the heavy lifting as users easily get metrics and insights into the state of their event streaming pipelines. The event streaming teams power this infrastructure and make sure that it can scale as needed (usually by continuing to own some big streams and by dogfooding the platform), but they generally stay out of the users’ way.
For users to be able to dynamically manage their own data pipelines while the pipelines team manages the operations to scale to a global fleet of IoT devices—that’s not an easy challenge, but it’s one that I am certainly looking forward to helping solve.
Interested in learning more?
If you’d like to learn more about how Tesla’s stream processing infrastructure works, check out my Kafka Summit talk where I do a deep dive on how we use some of the ideas above to process trillions of device events every day.
Disclaimer: The views and opinions expressed in this article are those of the author and do not necessarily reflect the official policy or position of Tesla Motors Inc.
Avez-vous aimé cet article de blog ? Partagez-le !
Abonnez-vous au blog Confluent
Why ELT Can't Keep Up in the Era of High-Scale Data Engineering
Batch ELT pipelines create duplication, cost spikes, and governance gaps as data scales. Here’s why enterprises are rethinking legacy integration models.
How to Protect PII in Apache Kafka® With Schema Registry and Data Contracts
Protect sensitive data with Data Contracts using Confluent Schema Registry.

